Why research is so important for us
What influence does the coronavirus have on the prediction of apartment requests? What does a leading indicator do? And why are we interested in customer behavior? Costas Leon, research and process specialist at GLANDON Apartments, reveals it in an interview.
Costas Leon, you are the research manager at GLANDON Apartments. Since when did research start at GLANDON and on which areas is this research?Costas Leon: I joined GLANDON in March 2018. At that time, we had a big amount of data produced by our software developers but there was no data processing except for the usual business reports. I had two directions in mind. The first was to create some useful summaries of what the data tell us in the form of averages and standard deviations along with useful visualizations. The second direction was modeling of the data in the sense that useful «theoretical relations» might be discovered. Both directions are active today.
What kind of data do you collect?
There are many areas in the company that produce their own data. For example, operation activities are related to enquiries and contracts, and the accounting department produces financial data. Important is that these data, which are produced at every moment, to be organized in a meaningful way. Thus, we have several statistical time series on a daily, weekly, and monthly frequency which are then aggregated into quarterly and yearly time series. At the moment, we have a full set of 43 time series which are aggregated on a monthly, quarterly and yearly basis.
What is the purpose of aggregation on a monthly and quarterly basis?
It is monitoring and forecasting. They allow not only for better understanding of the current business activity but also for a more efficient planning in the short and medium run.
You mentioned before the modelling of the data. Which areas does this modelling cover?
At the moment we cover 3 main areas: enquiries and contract forecasting, activity indicators and customer reviews.
Could you explain more about the forecasting of enquiries? Is forecasting successful?
Yes, of course. There are in total four forecasting models referring to weekly and monthly enquiries and finished enquiries (contracts). The dynamic structure (see Figure 1) of these models is different, and this is the reason that they are four distinct models. The models are estimated separately and then a mathematical optimization criterion is used for the forecasts to be mutually consistent. In general, all models are nested cases of the ARFIMAX class of models and follow the principles of General-to-Specific Modelling. This is a testing strategy which has been developed in the London School of Economics and the University of Oxford. The research at GLANDON shows that, under normal conditions, models with constant parameters are quite capable to mimic the dynamics observed in the actual time series. However, revision is a part of the process. Forecasting is most of the time successful in a statistical sense: the vast majority of forecasts are within the range that the model has predicted. However, it is not always successful in a business sense: the noise (unstructured information) sometimes is quite high so that a wide range is not practically meaningful from a business perspective. The noise partly determines the range of forecasting. Some other times, what appears as noise hides information whose structure is unknown, and it is difficult to be statistically identified. For example, the noise in the daily enquiries is quite different from the noise in weekly or monthly enquiries. In general, different time scales produce different statistical properties, including the noise component.
Figure 1: Autocorrelation and partial autocorrelation function of a hypothetical AR(2) process
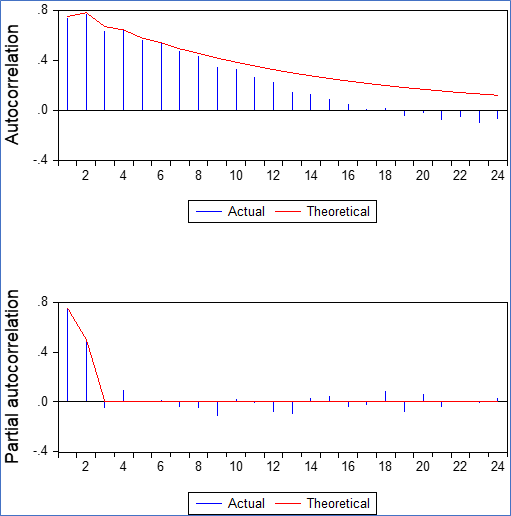
Source: interviewee’s estimations
Did Coronavirus play a role in the modelling of forecasts?
All the models mentioned above work effectively within a certain range of actual time series values. If these values exceed a lower or upper limit, the models cease to work effectively, and this is reflected on several performance metrics. The statistical structure of the models is not able to capture the real dynamics and the forecasts are neither optimal in some statistical sense nor practically useful. This led me to revise the structure of the models by introducing time-varying parameters by means of the Kalman filter (instead of constant parameters as under normal conditions) which could capture a part of the extremely unusual situation during the time of the coronavirus, Figure 2. These models proved to be better than the usual ones, but the instability reflected on the estimated parameters is so high that the forecasts were still not particularly useful for effective planning at the peak of the coronavirus.
Figure 2: Hypothetical process with time-varying autoregressive parameter
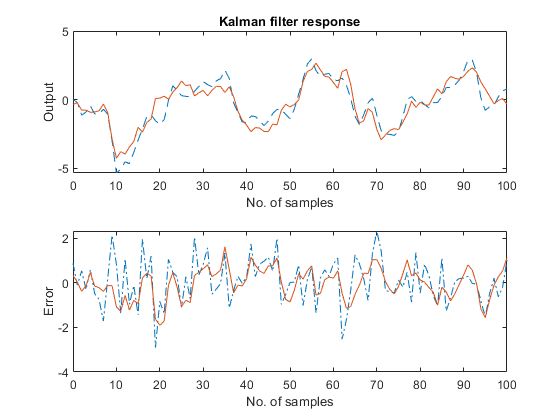
Source: https://it.mathworks.com/help/control/ug/kalman-filtering.html
What about the indicators? What are they and how are they useful?
In a business environment, an indicator is a time series, or a set of time series, that reflects the present or the future level of key activities. At GLANDON, the research department has built indicators at a more advanced level, similar to those developed by economic research institutions, e.g. KOF / ETHZ but with significantly lower number of time series. The main notion is that several time series are considered with reference to their dynamic properties, composed (synthesized) in an optimal way, and transformed into a single indicator which constitutes an optimal summary of the current or the future state of the business activity.
How many indicators have you developed?
I have developed 3 indicators: a leading indicator, a coincident indicator and diffusion index.
What does a leading indicator do?
The leading indicator can predict one month in advance the direction of motion of the revenue (up or down) under, determined by the data, probabilities. This indicator is analogous to those developed by macroeconomists in estimating the probability of recession in the economy. Therefore, this indicator can capture the turning points of the one-month ahead revenue which is considered as the reference series.
This sounds interesting. How effective is this prediction?
A leading indicator alone gives a correct prediction in 61% of the cases. Not bad but not impressive. However, the leading indicator combined with other time series improves the prediction. This is an ongoing project.
And what about the coincident indicator? What does it do?
The coincident indicator measures the current business activity. This is composed of an optimal mix of 7 time series. The movements of the «stronger» time series determine the direction of the indicator and its magnitude.
What is the diffusion index? What does it show?
This is another coincident indicator which measures the degree to which variables of interest move to the desired direction in the current period. For example, a simultaneous increase in enquiries and contracts contributes positively to this index whereas a decrease contributes negatively. If enquiries increase but contracts decrease or vice versa, then the index will move upwards or downwards or stay the same, depending on optimal weights evaluated at the estimation time. In other words, the diffusion indicator is an indicator of good, bad or neutral news.
You mentioned that you model the customer reviews. How the customer reviews are modelled at GLANDON?
As almost all companies, GLANDON keeps a record of their customer reviews. The reviews measure the quality of services as perceived by customers. There are four areas where the customers evaluate the service provided by GLANDON: cleanliness, environment, experience, and equipment. Then the average score of all these areas is estimated and gives an overall evaluation of the services provided.
Does the modeling of customer reviews differ from that of other companies?
The majority of the companies use descriptive measures, mainly averages, standard deviations and simple trend modelling whenever possible. At GLANDON, the statistical analysis of reviews has moved into more advanced modes of investigation. For example, a practical question is: what are the required values of cleanliness, equipment, etc. in order to achieve a desired target value for the average score? The analysis via statistical estimation and simulation identifies those areas which play the most significant role in the perception of the customers. GLANDON considers these areas and, therefore, both higher customer satisfaction and lower operating costs are achieved simultaneously.
What are the future plans?
I have already started working with some clustering and classification techniques, Figure 3. They are in their first phase of their development. They will help us understand similarities in the behavior of customers. For the moment, no concrete conclusions have been drawn.
Figure 3: Clustering and classification with hypothetical data
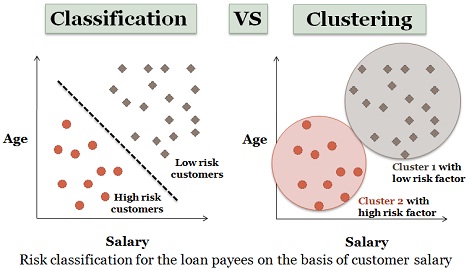
Source: www.techdifferences.com
You said that these techniques refer to the study of the behavior of the customers. Can one identify customers through these techniques?
No, both clustering and classification give collective behaviors in that they form groups of people within a cluster or a class. For example, we can realize that people who live in area A tend to behave in a specific way which is different from that of people who live in area B. This may lead to formulation of different policies. Personal identification is neither possible nor useful.
Did you discover any «theoretical relations» for which you talked in the beginning of the interview?
This is a remarkably interesting question and the answer is very difficult to be expressed succinctly. I would say, yes and no. Yes, because we see that there is some pattern among some variables of interest. No, because it is not possible to validly generalize these results to other companies. This would require a different approach. Further, and this is the most important: we do not really discover theoretical relations. This would be overly ambitious, and I would not trust someone who would arrive at such a statement. At best we have a set of hypotheses tested statistically but nothing else. The acceptance of statistical hypotheses is not identical to the discovery or acceptance of a theoretical framework.
Some final thoughts about the modelling at GLANDON?
Statistical techniques used at GLANDON belong to advanced modelling. Non-stationary time series analysis, vector error correction models, Kalman filter, and dynamic factor models are some examples of these techniques. However, as the renowned statistician George Box has said, «all models are wrong, but some are useful». By this he meant that all models capture some aspects of reality but leave other aspects outside. In this sense, all models are wrong. However, some of them are useful for some purposes. This is the way that I personally understand statistical modeling at GLANDON. Models are valuable tools that may work relatively well under strict assumptions which not all are necessarily met in practice. If this is the case, and usually it is, the quality of models as representation devices of reality is even lower. Given this limitation, they can give only a rough approximation of the reality, irrespective of their statistical sophistication. Nevertheless, the most important factors that determine the usefulness of these models are their meaningful interpretation and careful implementation. In a business environment many unpredictable factors may change the ordinary state of being and acting. Sometimes it is difficult to discern what is meaningful information and what is simply noise. I and GLANDON management are aware of this limitation and GLANDON formulates its business policy under this caveat.
Author